- 31 Dez.Vector 2021 Annual Review
- 15 Okt.Q3 Review
- 17 Aug.Chinese crackdowns
- 22 JuliVector 2021 Semi-Annual Review
- 25 JuniWhy we still like value
- 25 Mai'Transitory' Inflation
- 22 Apr.Reversal to the mean?
- 17 MärzVector's take on sustainable finance
- 19 Feb.David versus Goliath: An analysis of 2020 stock market performance
- 30 Dez.Vector 2020 Annual Review
- 20 Nov.Factor momentum
- 20 Okt.How will the US elections influence your portfolio?
- 25 Sept.Are better times for quant investing on the horizon?
- 26 Aug.Fama/French going through its biggest drawdown since 1963
- 17 JuliVector 2020 Semi-Annual Review
- 25 JuniA Look At Post-Corona Market Valuations
- 25 MaiUnprecedented times call for unprecedented measures...
- 23 Apr.Vector's outlook on the Corona Crisis
- 13 MärzMarket correction: sense or sentiment?
- 17 Feb.The market and sector concentration
- 14 Jan.Notice to shareholders
- 31 Dez.Vector 2019 Annual Review
- 17 Dez.Fama/French going through its second biggest drawdown since 1963
- 15 Nov.The Alpha Lifecycle
- 16 Okt.Vector 2019 Q3 Review
- 10 Sept.A new prospectus
- 14 Aug.Market Review: July
- 10 JuliVector 2019 Semi-annual Review
- 14 JuniAre factor premia disappearing?
- 21 MaiHow persistent is regional outperformance?
- 12 Apr.Market recovery: sense or sentiment?
- 12 MärzMarkets solidify recovery
- 12 Feb.Stock Markets Rebound
- 31 Dez.Vector 2018 Annual Review
- 14 Dez.2019 (outrageous) predictions!
- 20 Aug.Temperatures and stock markets heat up
- 18 JuliVector 2018 Semi-annual Review
- 14 JuniDo exporters suffer during trade wars?
- 15 MaiStrong earnings put markets on the road to recovery
- 17 Apr.Q1 Overview
- 13 MärzStock Markets: Episode VI: The return of volatility
- 02 MärzVector wins Morningstar Germany and Belgium Awards!
- 22 Feb.Vector Flexible wins De Tijd/L'Echo Awards for the third year in a row!
- 16 Feb.Navigator wins Morningstar France Award!
Can the Midterm Rally Skip the Dip?
31 Aug. 2026
Every four years, investors expect weakness before the U.S. midterms and relief afterwards. In 2026, the first half of that script is clearly missing...
Dear Investors,
Financial markets love a good one-liner. Sell in May and go away - but remember to come back in December. Don't fight the Fed. The trend is your friend. None is an iron law. Their appeal is that they turn decades of noisy market history into a story investors can remember.
One less famous rule of thumb returns every four years. The second year of a U.S. presidential term is supposed to be the awkward one. As the midterms approach, political uncertainty builds and equities lose momentum. Once voters settle the balance of power in Washington, uncertainty recedes and a relief rally carries the market into year three. That, at least, is the script.
"Difficult" does not necessarily mean that shares fall. Historically, the more consistent feature was that the market underperformed an ordinary year before the vote, then strengthened afterwards. That distinction matters: the midterm story is about relative weakness and recovery, not a guaranteed pre-election crash.
Why might such a pattern exist? Before the election, investors do not yet know how easily the White House will be able to advance its tax, spending and regulatory agenda. After the vote, the range of possible policy outcomes narrows.
That is a plausible hypothesis, not a proven mechanism. The post-election window also overlaps with the traditionally stronger November-to-April season, and a few exceptional rebounds can make an average look more dependable than it is.
This is what makes 2026 an interesting test. Through 31 August, our euro-converted MSCI USA total-return series had gained 14.8% since the start of the year. So far, the expected first act - a bruising pre-election stretch - has simply not materialised.
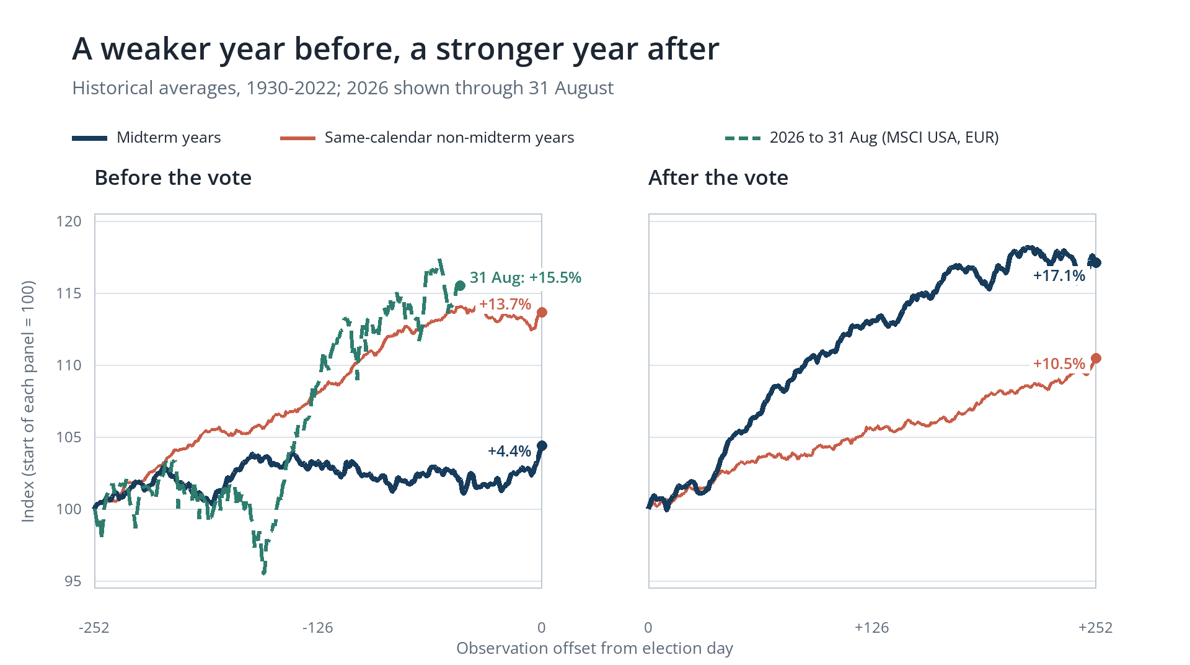
Mean historical Fama-French U.S.
total-market paths in USD for 24 midterms, 1930-2022, with same-calendar
controls; the 2026 line shows MSCI USA in EUR through 31 August (t-46).
The useful question is therefore no longer simply, "Will the midterm rally repeat?" It is whether the rally ever needed the dip in the first place - and what history can tell us when the market approaches November in good shape.Does the rally need the dip?
Does the rally need the dip?
To test whether the second act depends on the first, we split every completed cycle into the 252 daily observations before and after election day, then group the events by whether the run-up was positive or negative. We do this for the last 24 elections, spanning from 1930 to 2022.
Historical midterms |
Events (n) |
Before vote: t-252 to t0 |
After vote: t0 to t+252 |
|||
All midterms |
24 |
+4.4% |
+17.1% |
|||
Market up before the vote |
15 |
+16.5% |
+17.8% |
|||
Market down before the vote |
9 |
-15.7% |
+15.9% |
Source: Kenneth R. French Data Library (CRSP 202606)
Roughly one trading year after the vote, the market was higher in 22 of 24 cases - including 14 of the 15 positive run-ups and eight of the nine negative ones. The historical message is clear: the post-election advance did not require a pre-election decline.
What does that mean for 2027?
For now, 2026 is atypical relative to the average script, but clearly not outside historical experience. The market has behaved more like a healthy ordinary year than the sluggish midterm average, yet more than half of the historical run-ups in the expanded sample were positive. Strength before the vote does not disqualify strength afterwards. But that is evidence of possibility, not a return forecast. Even after election day, earnings, interest rates, valuations and the economy will matter far more than a calendar slogan.
Best regards,
Werner, Thierry & Nils
